
Oil Analysis: Turning Corrective Action into Cost-Saving Dividends
Why timely responses to oil analysis and root cause solutions are the key to unlocking productivity and shareholder value

Most organisations implementing oil analysis face the challenge of maximising operational cost savings while increasing shareholder value and achieving full production.
Oil analysis can deliver significant cost savings and productivity gains, but only if organisations implement effective corrective-action strategies. Without timely responses, problems repeat, escalate, and lead to costly failures.
Shesby Chabaya, head of operations, WearCheck Zimbabwe, provides information on how organisations can optimise operational cost savings by being responsive to the outcomes of analysis reports or by taking remedial action.
“To achieve financial savings, organisations must implement systems that facilitate the effective operation of the oil analysis programme and conduct periodic audits to ensure that the processes are being followed,” he says.

Breaking down the oil analysis
The oil analysis cycle begins with regular, systematic oil sampling, which generates data on an ongoing basis to support informed decision-making. The oil analysis or cost-savings cycle is iterative and can be detailed as follows:
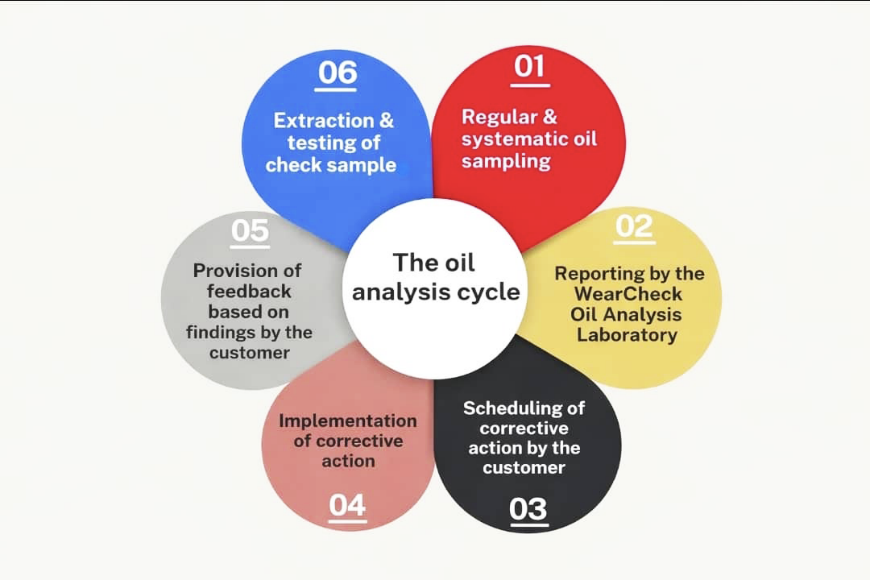
As illustrated in the diagram above, when oil sampling is done on a regular and systematic basis, problems are identified and reported by the laboratory, equipment is scheduled for troubleshooting and investigation, and then corrective action that addresses the root cause of the problem is implemented, guided by the response time indicated by the laboratory.
This results in performance improvement and cost savings. A check sample is taken to confirm improvement, and the process keeps repeating as machine operating hours increase.
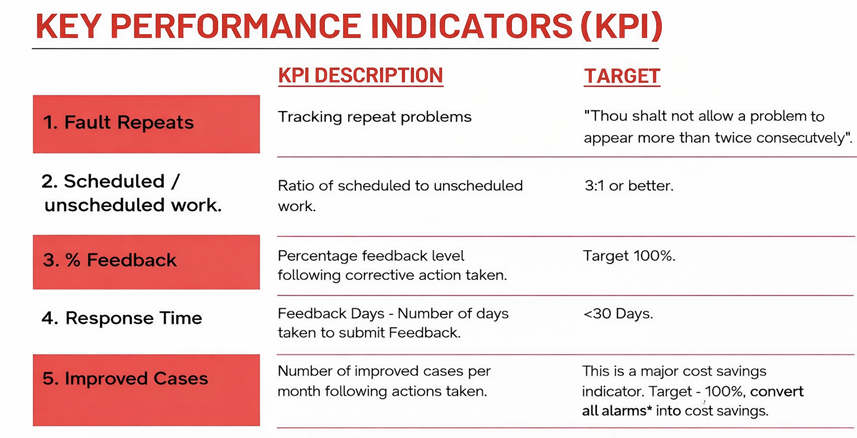
It is important to note that, in most cases, corrective action is taken, but the problem persists. The key is in addressing the root cause of the identified problem. The following KPIs can be utilised to track the effectiveness of corrective action taken or lack thereof:
The Big Picture Principle
It is insufficient to solely react to each oil sample result, even though this contributes immensely to overall cost savings. The big-picture principle must be consistently applied, with the maintenance engineer or manager adopting a strategic approach. This involves analysing the overall context, reviewing monthly and yearly trends, and assessing long-term outcomes and indicators. It prioritises key issues and emphasises solutions to identify fleet or plant problems, adaptability, and sustainability.
What cost savings are NOT!
In their recent study, WearCheck Zimbabwe examined a year’s worth of oil analysis data across all components on a mobile plant, including engines, transmissions, hydraulic systems and axles for a company in the manufacturing industry. Their findings were as follows:
- 46% of the annual oil samples extracted were alarms (Ratio almost 1:2).
- 28% of the total annual problems or alarms are repeat issues.
- 1 in every 3 alarms represented a repeat problem.
Interpretation: one in every two oil sample results is an alarm, and the total alarm figure is 27% above the set target for the year. The percentage of repeat problems is significant, meaning repeat problems are the key driver of the accumulated annual alarms/overall problematic oil samples.
Due to the high figures, such scenarios are described as “too costly and uneconomical.”
A persistent problem is a pointer to a slow response rate to alarms, or that the corrective action implemented did not address the root cause of the problem. Alternatively, it is simply indicative of the absence of corrective action. As such, the study further tested this assertion by examining the level of feedback, and the findings were as follows:
- The percentage feedback for the year was 28%.
- Average feedback days for cases where feedback was submitted: 186 days; some of the reports needing feedback were running into day 300 without any response.
Interpretation: only 28% of alarms had feedback submitted, and it took 186 days to submit the feedback. Some cases have gone without feedback for up to 300 days, which indicates a lack of responsiveness to alarms.
Based on the findings above, it can be concluded that with a feedback rate of 28%, a significant number of alarms went unresolved, leading to repeated faults and lost potential cost savings. The ongoing issues continued to recur, putting the fleet at risk of catastrophic failure, which would adversely affect productivity. This situation exemplifies a “Snowball Effect.”
How the Snowball Effect Works
A snowball rolling down a slope gathers more snow as it moves, causing it to grow larger and gain momentum. Eventually, it can become unstoppable. Similarly, a comprehensive analysis of oil data over two decades has shown that small, identified issues, if not addressed early, can develop into much larger and more complex problems over time. These recurring issues tend to escalate, often leading to component failure. This means that delaying the resolution of a problem significantly increases the likelihood that it will go unaddressed, ultimately putting the plant at risk of component failure, incurring expensive repair costs, and experiencing lost production.